Management Indicators
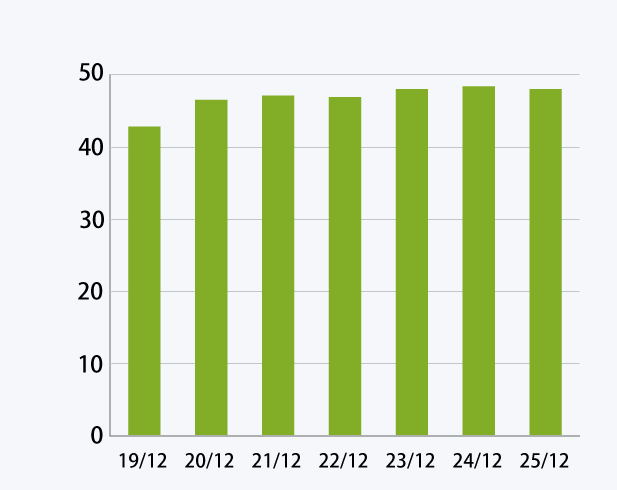
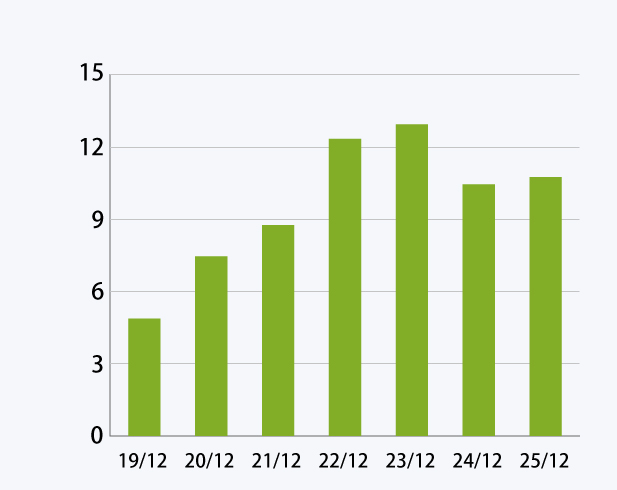
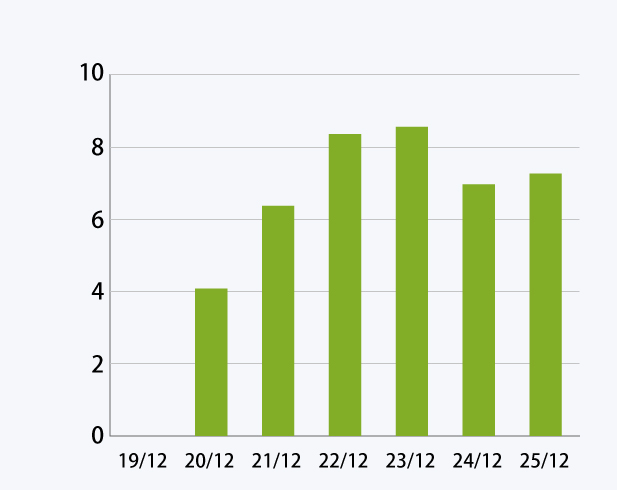
Profitability
(%)
| 2021/12 | 2022/12 | 2023/12 | 2024/12 | 2025/12 | |
|---|---|---|---|---|---|
| Gross profit ratio | 47.2 | 47.0 | 48.1 | 48.5 | 48.1 |
| Operating income ratio | 8.8 | 12.4 | 13.0 | 10.5 | 10.8 |
| Net income ratio | 6.4 | 8.4 | 8.6 | 7.0 | 7.3 |
Gross profit ratio
(%)
Operating income ratio
(%)
Net income ratio
(%)
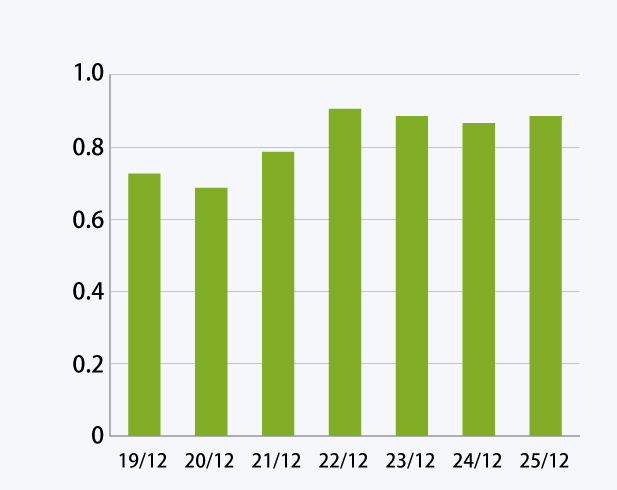
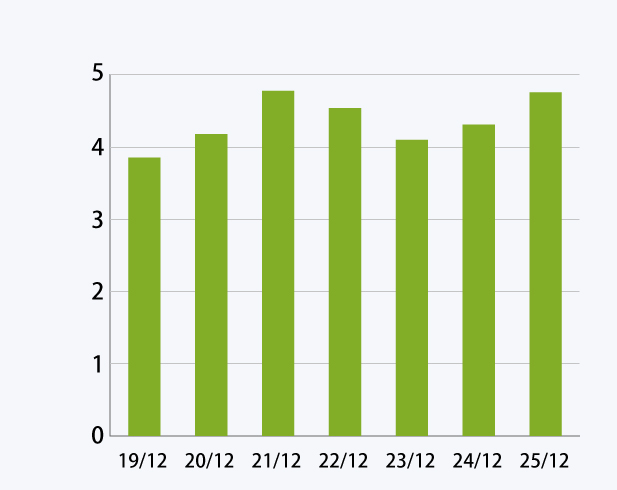
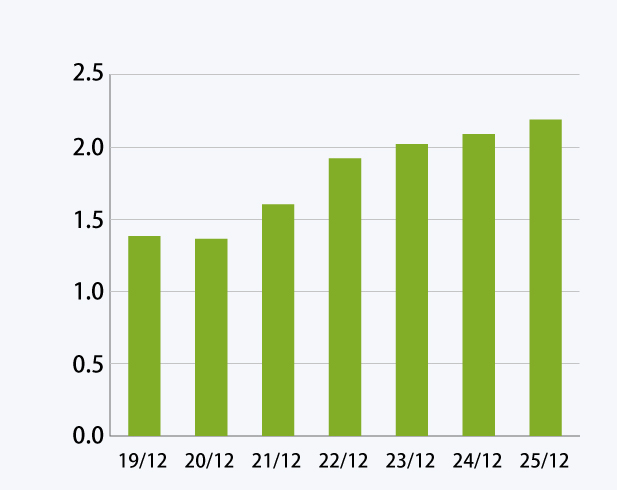
Efficiency
(Times)
| 2021/12 | 2022/12 | 2023/12 | 2024/12 | 2025/12 | |
|---|---|---|---|---|---|
| Total asset turnover | 0.79 | 0.91 | 0.89 | 0.87 | 0.89 |
| Inventory turnover | 4.80 | 4.56 | 4.12 | 4.33 | 4.78 |
| Fixed assets turnover | 1.61 | 1.93 | 2.03 | 2.10 | 2.20 |
* The amount of total assets, inventory and fixed assets are calculated using the average of the figures at the beginning and end of the period.
Total asset turnover
(Times)
Inventory turnover
(Times)
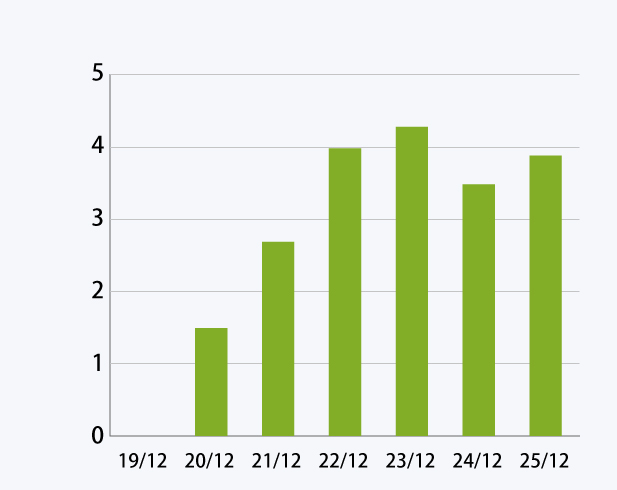
Fixed assets turnover
(Times)
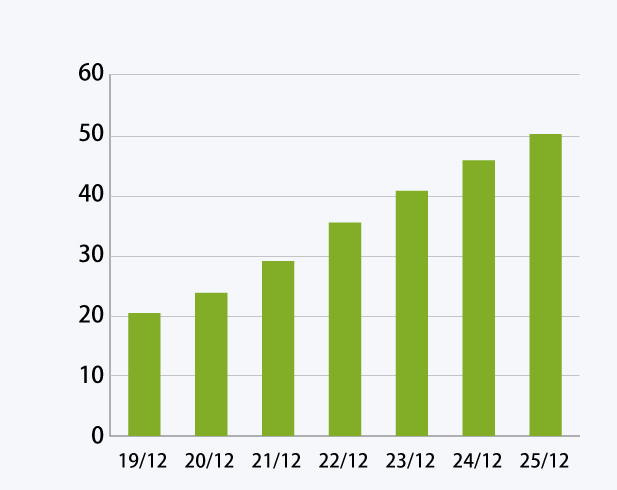
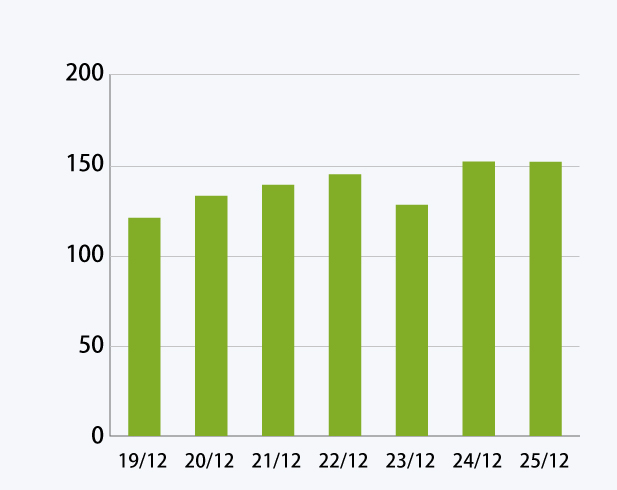
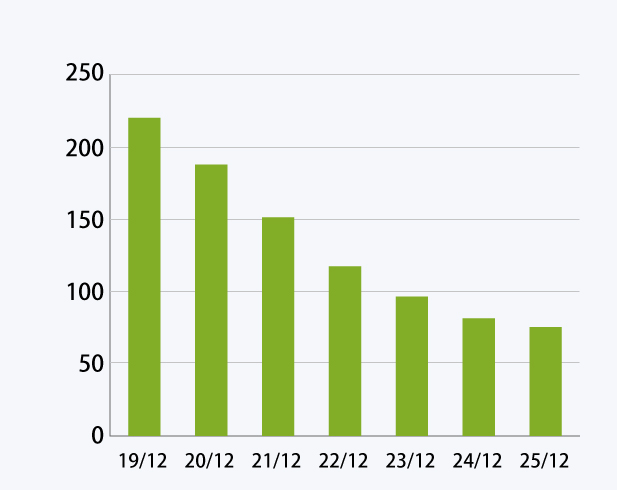
Stability
(%)
| 2021/12 | 2022/12 | 2023/12 | 2024/12 | 2025/12 | |
|---|---|---|---|---|---|
| Shareholders’ equity ratio | 29.2 | 35.6 | 40.9 | 46.0 | 50.4 |
| Liquidity ratio | 139.7 | 145.6 | 128.6 | 152.7 | 152.5 |
| Fixed assets ratio | 152.1 | 117.9 | 96.9 | 81.8 | 75.7 |
Shareholders’ equity ratio
(%)
Liquidity ratio
(%)
Fixed assets ratio
(%)
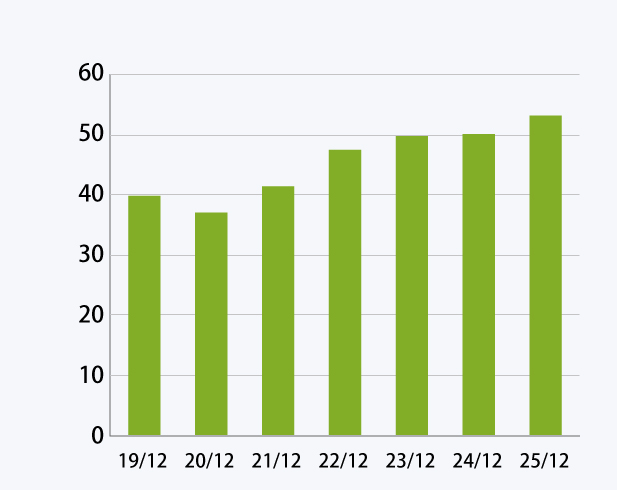
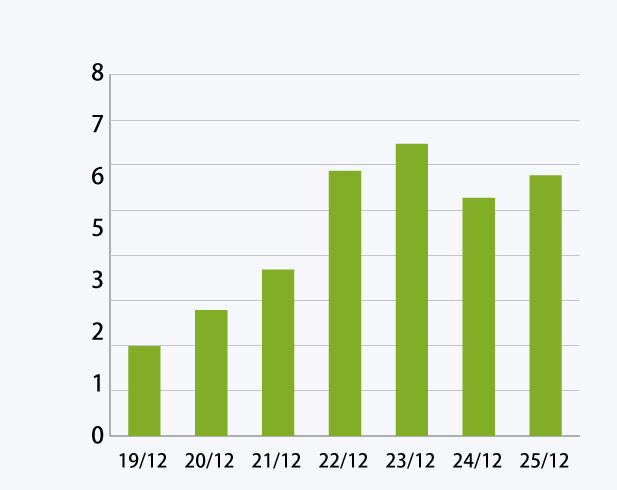
Productivity
(Millions of yen)
| 2021/12 | 2022/12 | 2023/12 | 2024/12 | 2025/12 | |
|---|---|---|---|---|---|
| Net sales per employee | 41.5 | 47.6 | 49.9 | 50.2 | 53.3 |
| Operating income per employee |
3.7 | 5.9 | 6.5 | 5.3 | 5.8 |
| Net income per employee |
2.7 | 4.0 | 4.3 | 3.5 | 3.9 |
| Number of employees (persons) (Average number of part time employees) |
556 92 |
576 102 |
585 112 |
601 108 |
596 112 |
* Net sales per employee, operating income per employee and net income per employee are calculated using the average number of employees during the period.
Net sales per employee
(Millions of yen)
Operating incomeper employee
(Millions of yen)
Net income per employee
(Millions of yen)
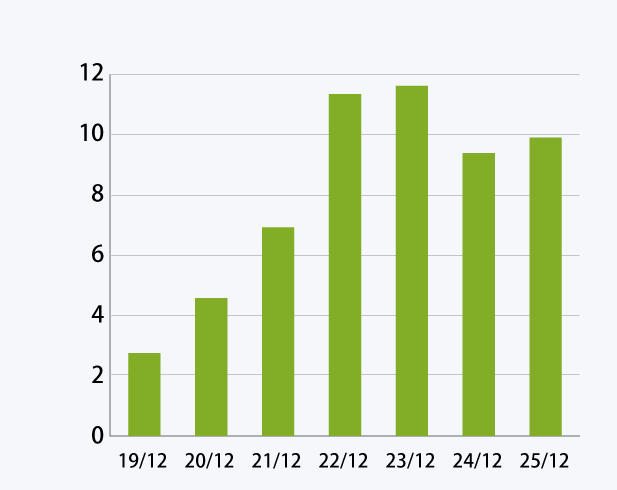
Cash flows
(Millions of yen)
| 2021/12 | 2022/12 | 2023/12 | 2024/12 | 2025/12 | |
|---|---|---|---|---|---|
| Free cash flow | 3,824 | 847 | 1,204 | 3,207 | 3,363 |
| Capital expenditure | 288 | 381 | 404 | 453 | 632 |
| Depreciation | 1,416 | 1,484 | 1,673 | 1,856 | 1,916 |
* Free cash flow= cash flows from operating activities + cash flows from investing activities
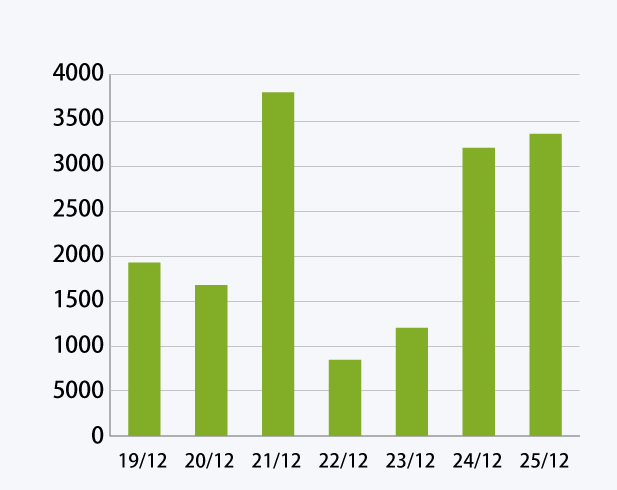
Free cash flow
(Millions of yen)
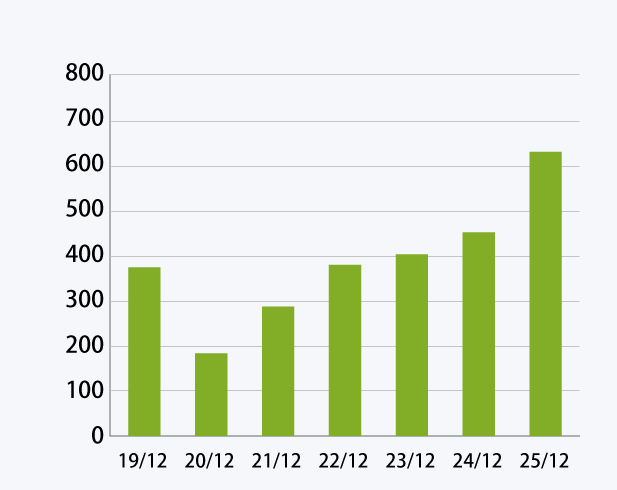
Capital expenditure
(Millions of yen)
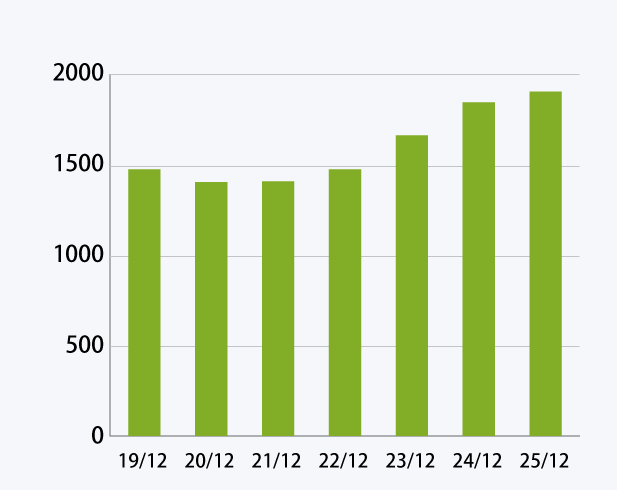
Depreciation
(Millions of yen)
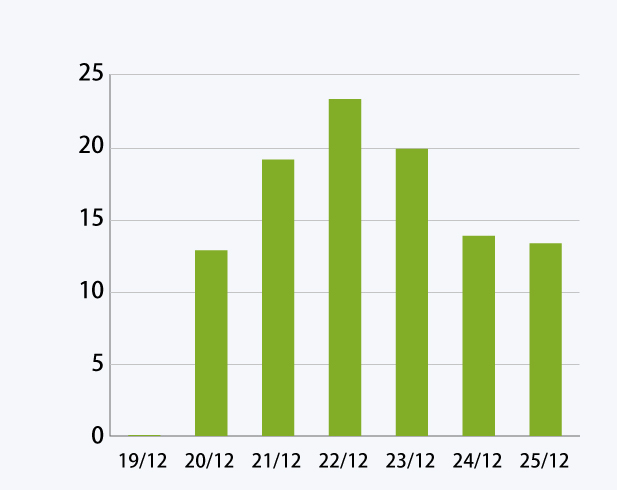
Other Investment Indicators
(%)
| 2021/12 | 2022/12 | 2023/12 | 2024/12 | 2025/12 | |
|---|---|---|---|---|---|
| Return on equity (ROE) |
19.22 | 23.42 | 19.97 | 13.92 | 13.39 |
| Return on assets (ROA) |
6.96 | 11.41 | 11.69 | 9.44 | 9.96 |
* Shareholder’s equity and total assets are an average of the amount at the beginning of the period and the amount at the end of the period, respectively.
Return on equity(ROE)
(%)
Return on assets(ROA)
(%)
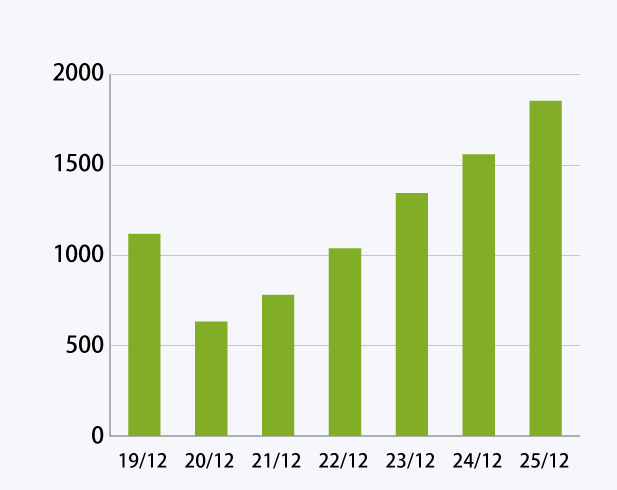
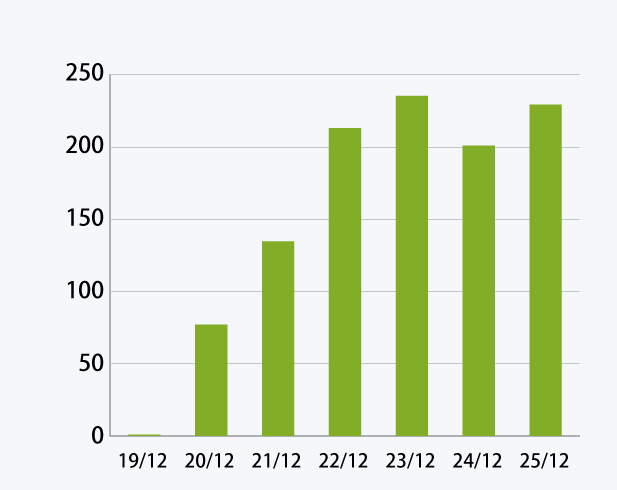
Indicators per share
(yen)
| 2021/12 | 2022/12 | 2023/12 | 2024/12 | 2025/12 | |
|---|---|---|---|---|---|
| Net income per share | 135.36 | 214.12 | 236.45 | 201.86 | 230.39 |
| Net assets per share | 784.57 | 1,043.37 | 1,350.69 | 1,566.12 | 1,864.98 |
* Shareholder’s equity and total assets are calculated using the average of the figures at the beginning and end of the period.
Net income per share
(yen)
Net assets per share
(yen)